| source : Annual Report 2021 | Oct - Sep 2021 |
Oct - Sep 2020 |
|
Statements of Income (Mil.Baht) |
|||
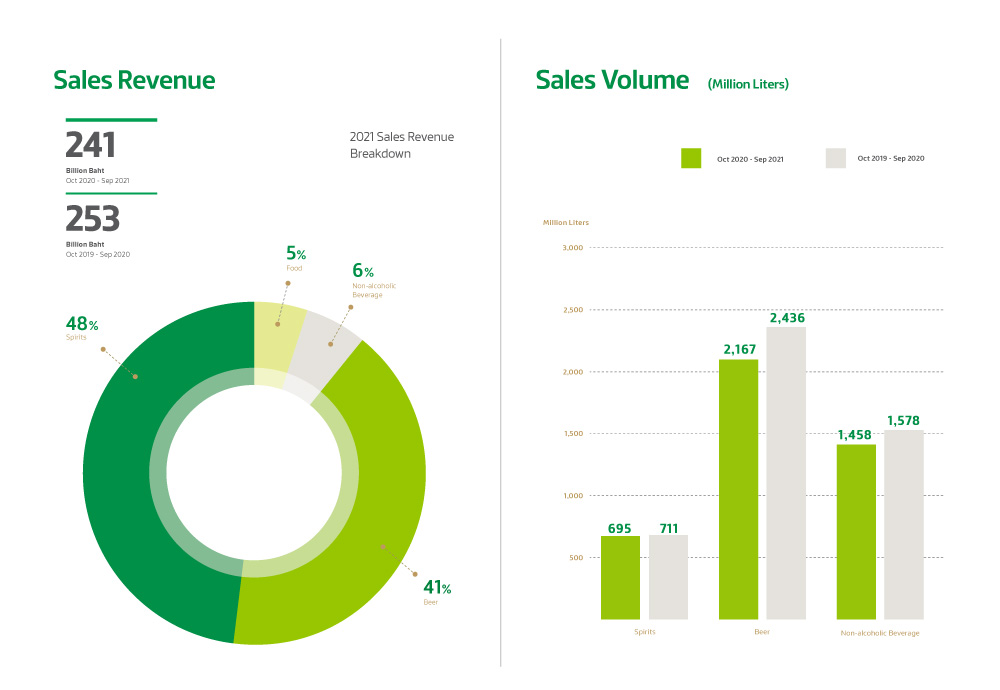
| Revenue from sales | 240,543 | 253,481 | |
| Total revenues | 245,559 | 259,392 | |
| Cost of sales | 169,060 | 178,620 | |
| Gross profit | 71,483 | 74,861 | |
| Operating profit | 33,782 | 34,600 | |
| EBIT | 38,798 | 39,979 | |
| Net profit | 27,339 | 26,065 | |
| Depreciation and amortization | 7,831 | 6,565 | |
| EBITDA | 46,629 | 46,544 | |
Statements of Financial Position (Mil.Baht) |
|||
| Current assets | 95,266 | 86,315 | |
| Non-current assets | 377,319 | 347,205 | |
| Total assets | 472,585 | 433,520 | |
| Current liabilities | 95,443 | 90,752 | |
| Non-current liabilities | 166,966 | 163,363 | |
| Total liabilities | 262,409 | 254,115 | |
| Equity | 210,176 | 179,405 | |
| Total liabilities and equity | 472,585 | 433,520 | |
Liquidity Ratio |
|||
| Current Ratio | times | 1.00 | 0.95 |
| Quick Ratio | times | 0.52 | 0.49 |
| Average Collection Period | days | 7.43 | 7.34 |
| Average Inventory Period | days | 94.34 | 86.60 |
| Average Payable Period | days | 14.21 | 14.66 |
| Cash Cycle | days | 87.56 | 79.28 |
Profitability Ratio |
|||
| Gross Profit Margin | % | 29.72 | 29.53 |
| EBITDA Margin | % | 19.38 | 18.36 |
| EBIT Margin | % | 16.13 | 15.77 |
| Operating Cash Flows to Operating Profit Ratio | % | 94.92 | 107.70 |
| Net Profit Margin | % | 11.37 | 10.28 |
| Return on Equity | % | 14.04 | 15.81 |
Efficiency Ratio |
|||
| Return on Assets | % | 6.03 | 6.20 |
| Return on Fixed Assets | % | 44.79 | 42.96 |
| Total Assets Turnover | times | 0.53 | 0.60 |
Leverage Ratios |
|||
| Liability to Equity Ratio | times | 1.25 | 1.42 |
| Interest Bearing Debt to Equity Ratio * | times | 1.04 | 1.21 |
| Net interest bearing debt to EBITDA * | times | 3.88 | 3.91 |
| Interest Coverage Ratio | times | 6.83 | 6.60 |
* Interest bearing debt from bank and debentures